Updated October 2026 | Sales through September 30, 2026
There are certain streets in Oakville that have always carried a bit more weight.
Everyone knows the big neighbourhoods. Morrison, Old Oakville and the waterfront consistently produce some of the highest sales in town. But within those neighbourhoods there are smaller pockets where values move to another level again.
Chartwell is probably the obvious example, but it is far from the only one. Ennisclare, Hillhurst, Park Avenue, Balsam and Gloucester have all produced some very strong sales over the last few years.
And then there are streets like Wolfdale, Brentwood and Westdale, where the right property can push well into eight figures.
So which streets are actually the most expensive?
Ennisclare Has Been Hard to Beat
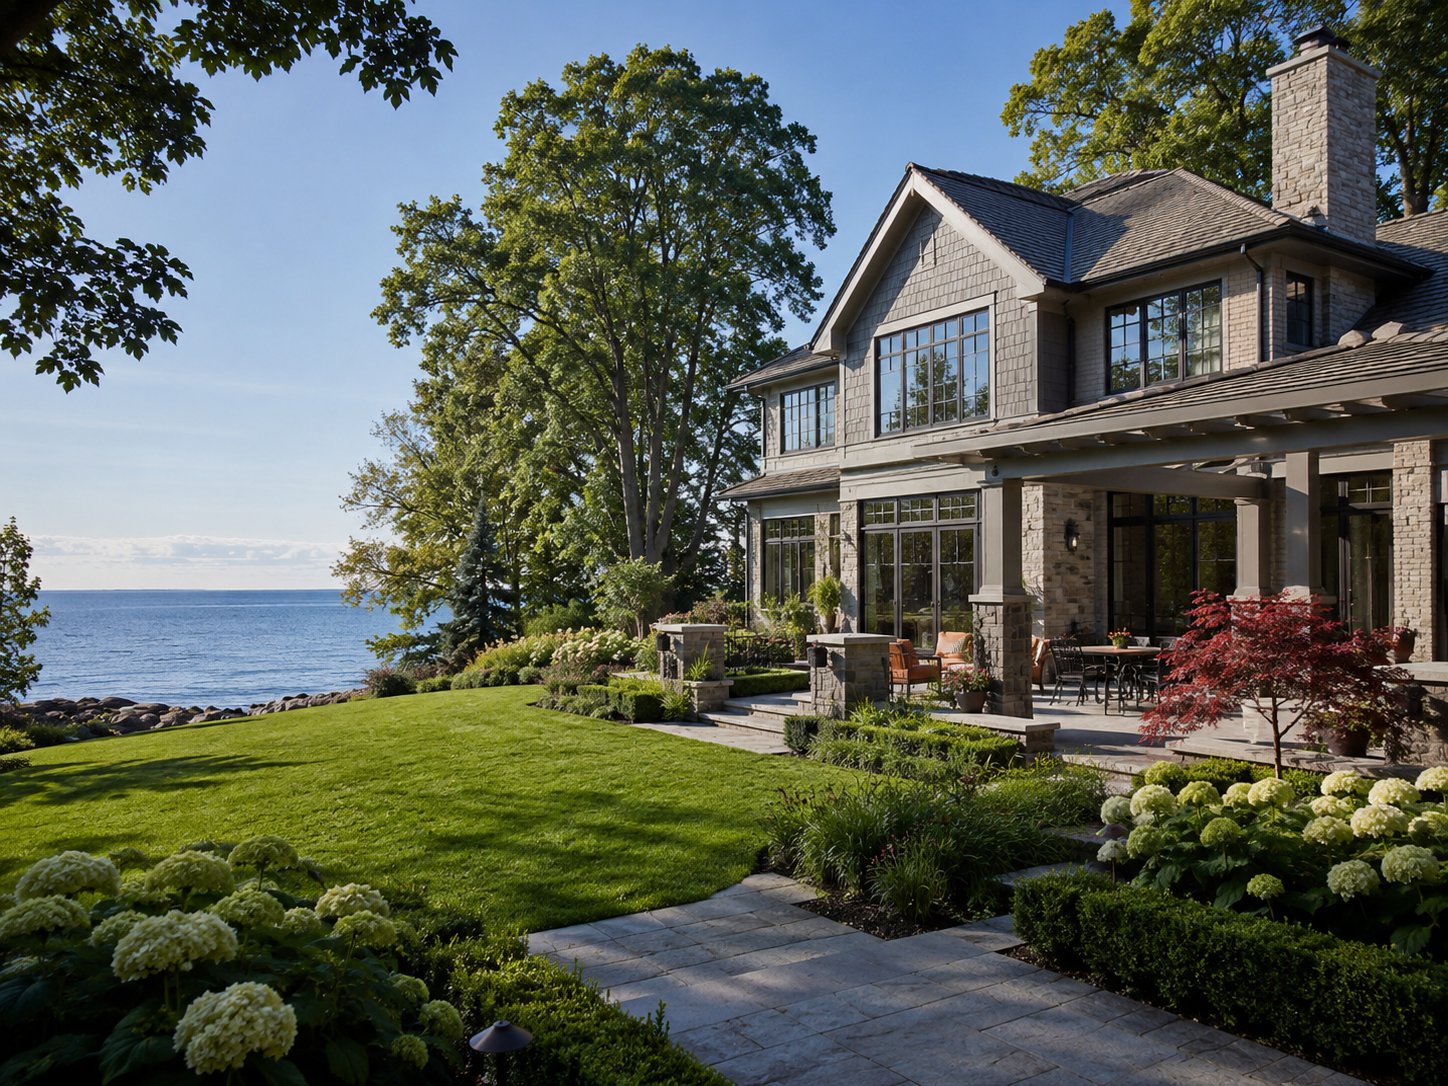
Ennisclare Drive came out at the top of the list, with three recent sales averaging approximately $7.78 million.
The standout was 21 Ennisclare Drive, which sold for $12.6 million earlier this year. The other sales were lower, but still very much at the upper end of the Oakville market.
It is not hard to understand the appeal. Ennisclare is quiet, mature, close to the lake and has very little turnover. When a good property does come to market there, buyers are usually paying for a combination that is difficult to replace elsewhere.
That said, one $12.6 million sale has a pretty big impact when there are only three transactions. Which brings us to Chartwell.
Chartwell Is in a Category of Its Own
Chartwell did not have the highest average, but it probably had the most impressive numbers overall.
There were 13 sales during the period, averaging approximately $5.58 million.
Seven of them sold above $5 million.
At the top were 199 Chartwell at $10.3 million and 140 Chartwell at $10.2 million.
Thirteen sales averaging more than $5.5 million is probably a better indication of the strength of a street than one or two huge transactions.
That is really what makes Chartwell stand out. There is depth to the market.
You have major estate properties at the top end, but you also consistently see strong sales below that level. Buyers know the street, they know the setting and they are willing to pay for it.
It also runs through several of the best pockets of Southeast Oakville, moving between Old Oakville, Orchard Beach and Morrison.
Old Oakville Is a Different Story
The luxury market in Old Oakville tends to feel a little different.
It is not always about the biggest house or the biggest lot. Proximity to Downtown Oakville, the lake, mature streets and limited supply all play a big role.
First Street averaged approximately $5.9 million across three sales, including two around $7.4 million.
Balsam Drive averaged approximately $4.71 million, while Gloucester Avenue came in at roughly $4.67 million.
These are streets where buyers are often paying just as much for the location and setting as they are for the house itself.
Park Avenue Shows How Different Two Homes Can Be
Park Avenue is another great example.
Five homes sold for an average of approximately $5.39 million, but the actual sale prices ranged from just over $2 million to $10.1 million.
That $10.1 million sale at 27 Park Avenue was the highest Oakville sale in 2025.
Same street, but completely different properties.
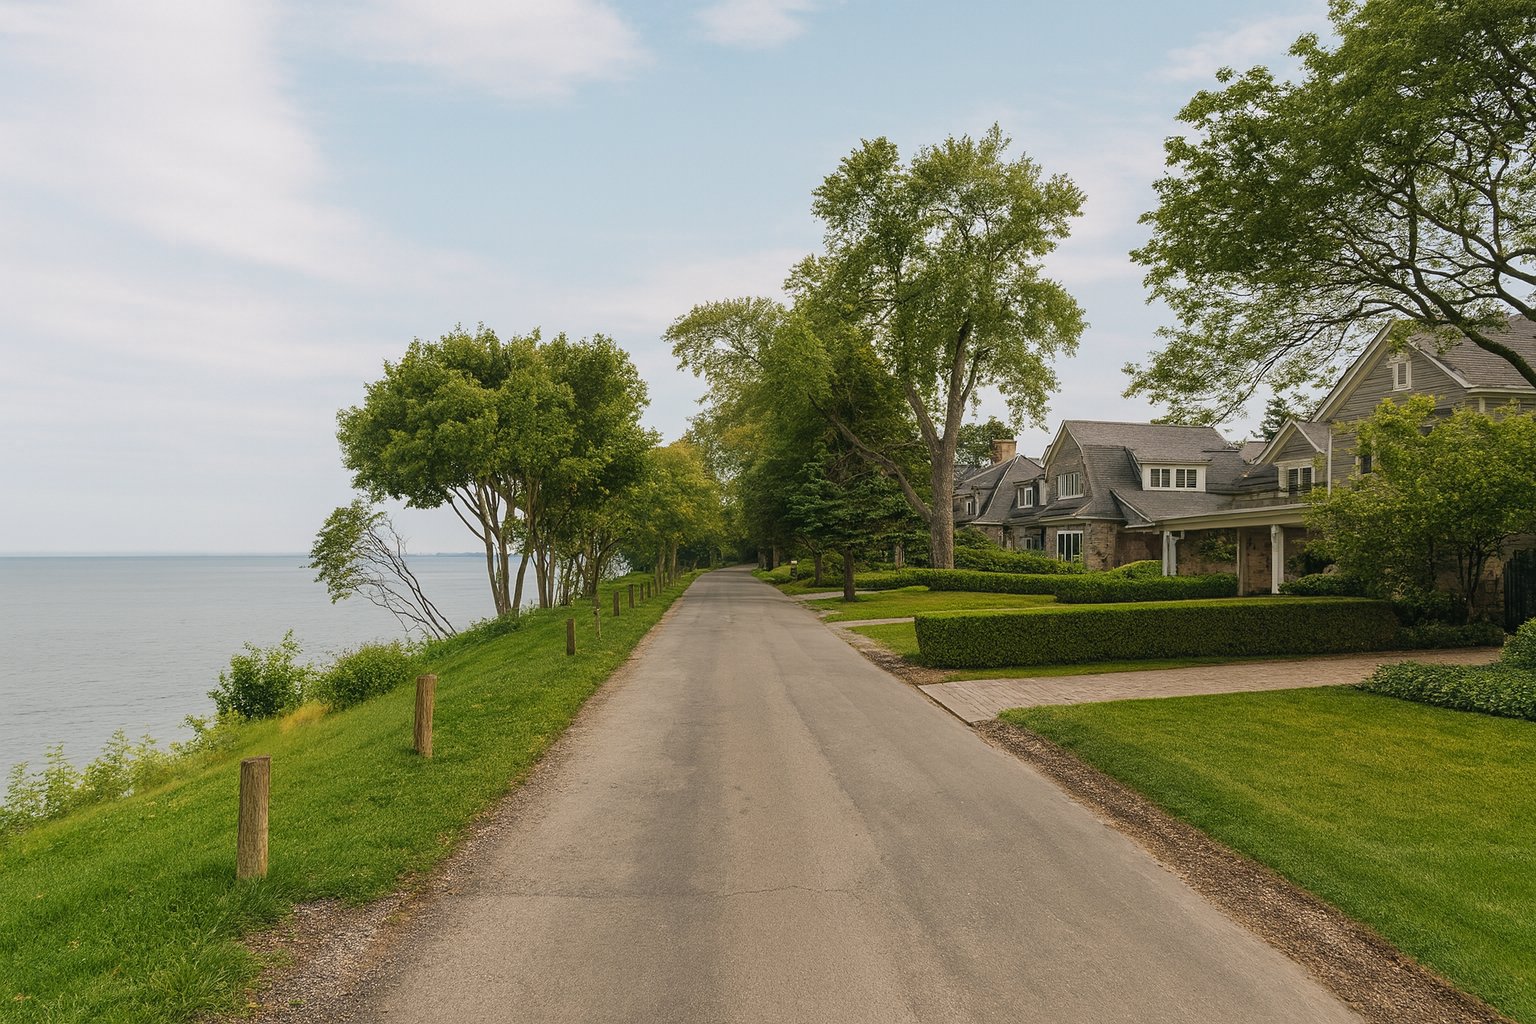
This is especially true in Orchard Beach, where the homes can be very different from one another and there simply are not many sales in any given year.
Morrison Still Dominates the List
Once you get past Ennisclare and Chartwell, Morrison continues to show up.
Hillhurst averaged approximately $5.87 million, with three sales between roughly $5.1 million and $6.8 million.
Poplar averaged approximately $4.66 million, Donlea approximately $4.55 million and Dianne approximately $4.36 million.
Five of the ten streets at the top of the list were in Morrison.
That lines up with what we have been seeing in the broader neighbourhood numbers as well. Morrison continues to be one of the most consistent areas in Oakville for higher-end detached homes.
Then You Have the Really Big Sales
The highest individual transactions tell a slightly different story.
In 2024, 88 Wolfdale Avenue sold for $18.6 million.
This summer, 35 Brentwood Road sold for $18.5 million.
Only $100,000 separated them.
And 1128 Westdale Road sold for $17 million.
At that level, though, it becomes less about the street average and much more about the individual home.
Waterfront, land, privacy, architecture and overall scale start to outweigh almost everything else.
That is why I would not suddenly call Wolfdale the most expensive street in Oakville because one home sold for $18.6 million.
It was an exceptional sale because it was an exceptional property.
What About Lakeshore Road?
Lakeshore is probably the first answer a lot of people would give if you asked them to name Oakville's most expensive street.
And there are certainly some incredible properties along it.
But Lakeshore is long and the housing is incredibly varied.
There were 31 sales during this period, averaging approximately $3.66 million, with the highest at $9.5 million.
A major waterfront property and another home a kilometre down the road may share the same street name, but they can be completely different from a value perspective.
So Which Street Is Actually the Most Expensive?
If we are talking strictly about the highest average from streets with at least three recent sales, it is Ennisclare Drive.
But Chartwell is probably the street that stands out most to me.
Thirteen sales, an average above $5.5 million and seven sales above $5 million is a very strong run.
And that is really the bigger point.
In Oakville, there are great neighbourhoods and there are great streets within those neighbourhoods, but once you get into the top end of the market the individual property becomes more important than almost anything else.
A Morrison address can help. A great street can help more. But at the top of the market, the house and the lot still make the biggest difference.
Thinking About Buying or Selling in Oakville?
If you are looking at a particular home, street or neighbourhood, I am always happy to give you some context around what has been selling and how the property compares.
Sales data reflects reported freehold residential transactions from January 1, 2024 through September 30, 2026. Street averages are provided for general market context and are not an appraisal of any individual property. Waterfront position, lot size, condition, architecture, renovations and other property-specific factors can materially affect value.